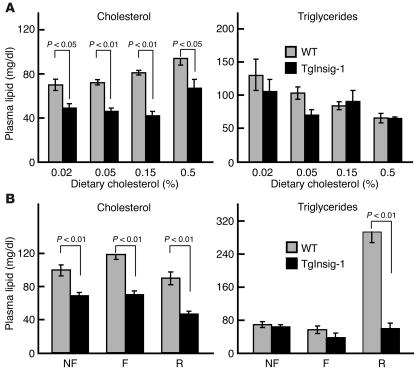
Figure 7.
Plasma lipid levels in WT and TgInsig-1 mice fed different amounts of cholesterol (A) or subjected to fasting and refeeding (B). Mice used in A are described in Figure 2; mice used in B are described in Figure 4. Each value is the mean ± SEM of data from four or five mice. The levels of statistical significance (Student’s t test) between the WT and TgInsig-1 groups are shown as P values. F, fasted group; R, refed group.

