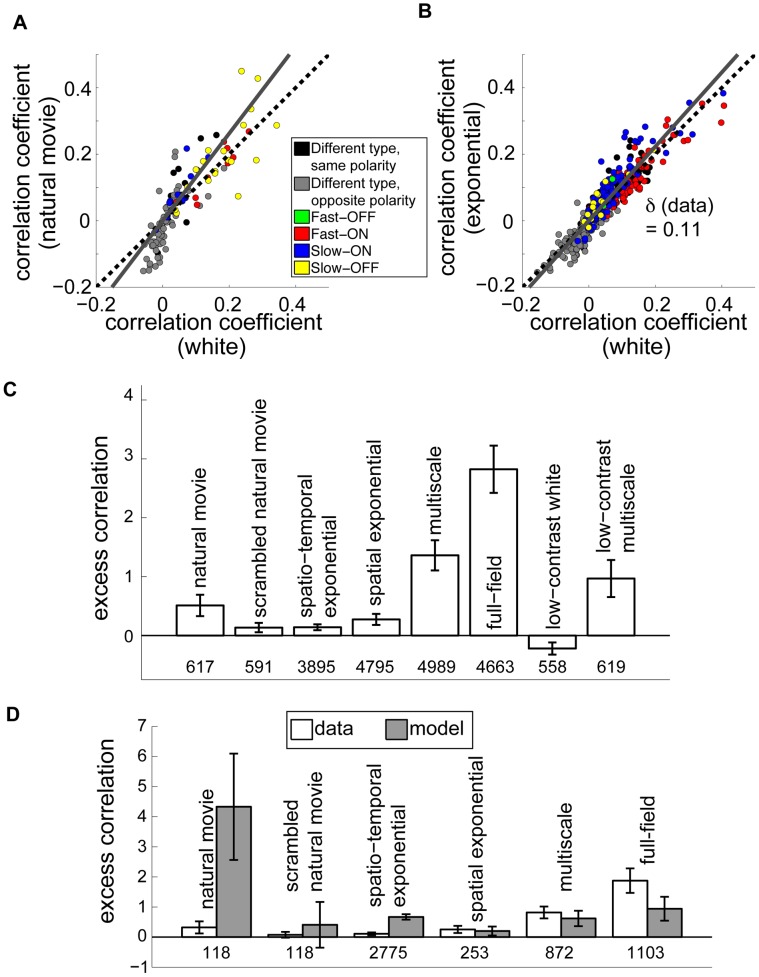
Figure 3. Retinal output correlations are largely constant between stimulus conditions.
(A) Instantaneous spike train correlation coefficients between pairs of ganglion cells, comparing responses to natural movies and to white noise. Dashed black line is the diagonal. Cell pairs of the same class are indicated by colors in the legend. Different- class pairs are separated into ON-OFF (gray) and ON-ON or OFF-OFF pairs (black). The excess correlation,  , is the deviation of the slope of the best fit line (gray) from the diagonal. (B) Same as (A) but for spatio-temporal exponentially correlated stimulus. (C) Excess correlation measured from ganglion cells responding to the indicated stimulus, compared to white noise. Numbers below bars indicate the number of cell pairs in each condition; all recorded cells are included. Error bars are 95% bootstrap confidence intervals computed over 50,000 random samples with replacement from the set of cell pairs. (D) Comparison of measured excess correlation (white) to non-adapting model predictions (gray) for the indicated stimuli. Model values were derived from LN neurons with parameters fit to white noise data. Only cells whose receptive fields met a quality threshold are used here, in contrast to (C).

