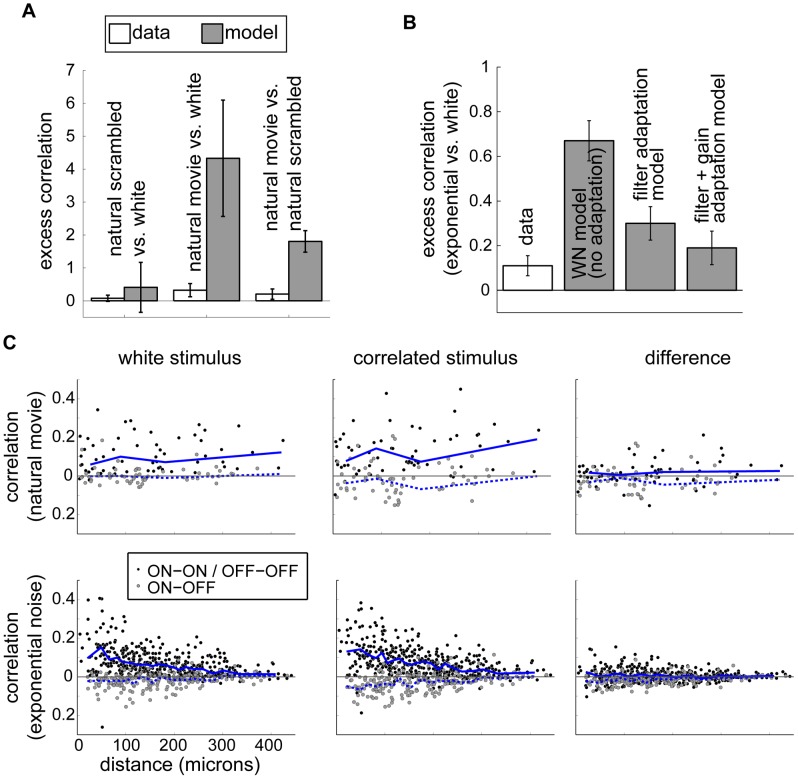
Figure 4. Analysis of pairwise correlations.
(A) Excess correlations for natural stimuli. Left and middle bars show excess correlation when scrambled natural movies and intact natural movies, respectively, are compared to white noise in the data and in a population of non-adapting model neurons. Right bars show excess correlation when responses to natural movies are compared to scrambled natural movies directly. A non-adapting model predicts larger output correlations in response to the correlated natural input than seen in the data. (B) Output correlations under the spatio-temporal exponential stimulus compared with white noise as predicted by LN models with parameters fit to the data. The two leftmost bars (“data” and “WN model (no adaptation)”) reproduce the spatio-temporal “data” and “model” bars in Fig. 3D. (Note the difference in scale.) For the other bars, we simulated a population of neurons using linear filters measured from each stimulus but gains measured only from white noise (“filter adaptation model”) or using experimentally derived estimates of both linear filters and gains for each stimulus (“filter+gain adaptation model”). In the fully adapted model, excess correlations are consistent with the data. (C) Pairwise output correlation as a function of the distance between receptive field centers. Top row: Output correlations for white noise checkerboard (left) and natural movies (middle) and the difference in correlation between these conditions (right) for experiments where natural movies were presented. Bottom row: Output correlations for white noise checkerboard (left) and spatio-temporal exponential noise (middle) and the difference in correlation between these conditions (right) for experiments where spatio-temporal exponential noise was presented. Each point corresponds to one simultaneously recorded cell pair; within a row, the same pairs are represented in all three panels. Blue lines are the median correlation within bins chosen to contain 30 cell pairs each. Solid lines are median correlations for same-polarity cell pairs; dashed lines are for opposite-polarity pairs.

