Figure 6.
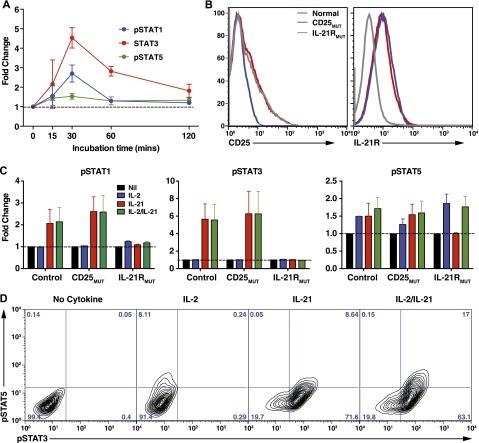
Effect of IL-2 and IL-21 on STAT phosphorylation in human B-cell lines. (A) LCLs from normal donors were incubated for varying times in the absence or presence of IL-21. Phosphorylation of STAT1, STAT3, and STAT5 was then determined by intracellular staining and flow cytometry. Data are depicted as fold change in mean fluorescence intensity of pSTAT in the presence of IL-21 over media alone. Results represent mean ± SEM of experiments using LCLs from 6 different donors. (B) Expression of CD25 and IL-21R was determined on LCLs derived from different normal donors (red histogram) or CD25-deficient (blue histogram) or IL21R-deficient (gray histogram) patients (n = 2/group). (C-D) Normal, CD25-deficient (CD25MUT), and IL-21R–deficient (IL-21RMUT) LCLs were incubated in the absence (Nil) or presence of IL-2, IL-21, or IL-2/IL-21. Expression of pSTAT1, pSTAT3, and pSTAT5 was determined after 30 minutes. Results in C are expressed as fold change above pSTAT expression in cells cultured with no cytokine and represent mean ± SEM of experiments using LCLs from 2 different donors or patients. D shows representative contour plots demonstrating coexpression of pSTAT3 and pSTAT5 in LCLs cultured in the absence (no cytokine) or presence of IL-2, IL-21, or IL-2/IL-21.

