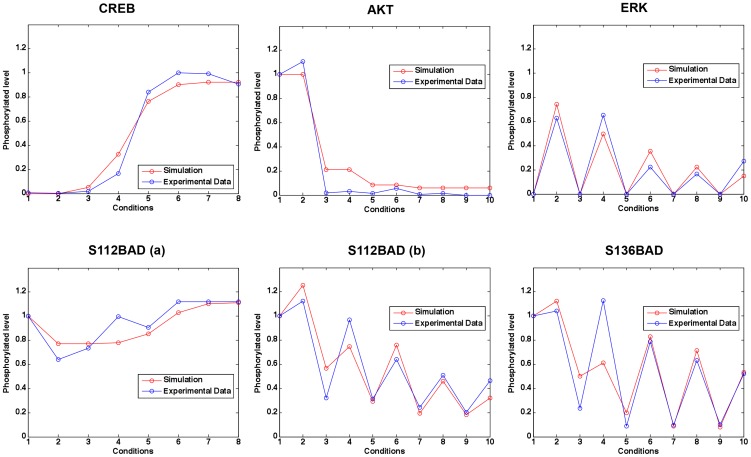
Figure 3. Simulation results of phosphorylated levels of some proteins under different conditions compared to experimental data.
Different conditions correspond to different treatments (see right panel of Figure 2). Mean squared error between the simulated data and experimental data is 0.1211.

