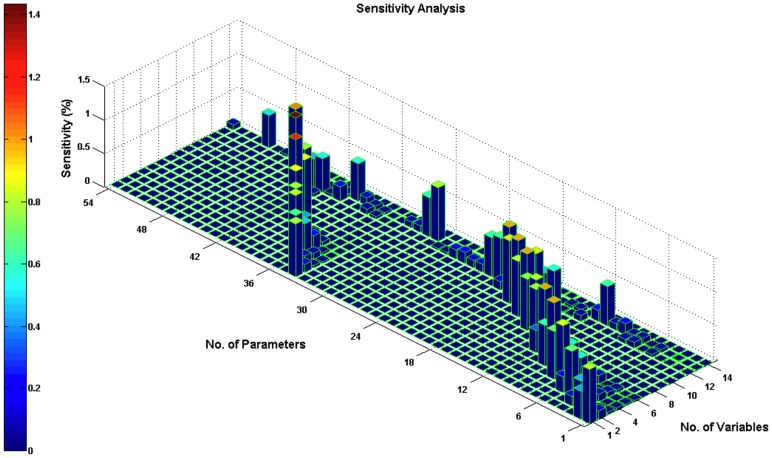
Figure 5. Sensitivity analysis for the estimated parameters.
Variables 1–13 correspond to the proteins in Equation (1–13) respectively; variable 14 is apoptosis percentage. Parameters 1–54 were listed in Table S1, 2. Each parameter was increased by 1% from its estimated value; then we obtained the time-averaged percentage change of each variable value. All the sensitivity values were below 1.4327%. The sensitivity analysis result confirmed that the developed system is preserved to the modest parameter changes and our model is rather robust.

