. 2012 May 18;45(8):753–762. doi: 10.1590/S0100-879X2012007500084

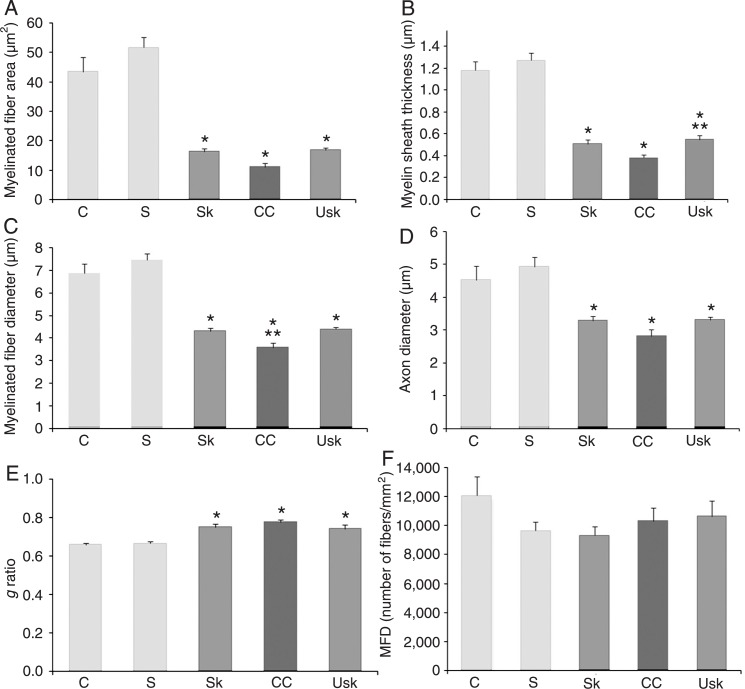
Figure 5. Effects of treatment on the morphometric parameters of regenerating median nerve fibers. Graphics show means ± SEM of A, myelinated fiber area; B, myelin sheath thickness; C, myelinated fiber diameter; D, axon diameter of the myelinated fiber; E, g ratio, and F, myelinated fiber density (MFD). *P < 0.05 compared to the control and sham groups. In B, **P < 0.05 for the difference between the unskilled training and crush group. In C, **P < 0.05 for the difference between the injured treated (skill and unskilled training) groups and the injured group (crush). C = control group; S = sham; Sk = skill training; CC = crush; Usk = unskilled training (one-way ANOVA followed by the Duncan multiple range test).

Figure 5.