. 2012 Mar 2;45(5):450–458. doi: 10.1590/S0100-879X2012007500025

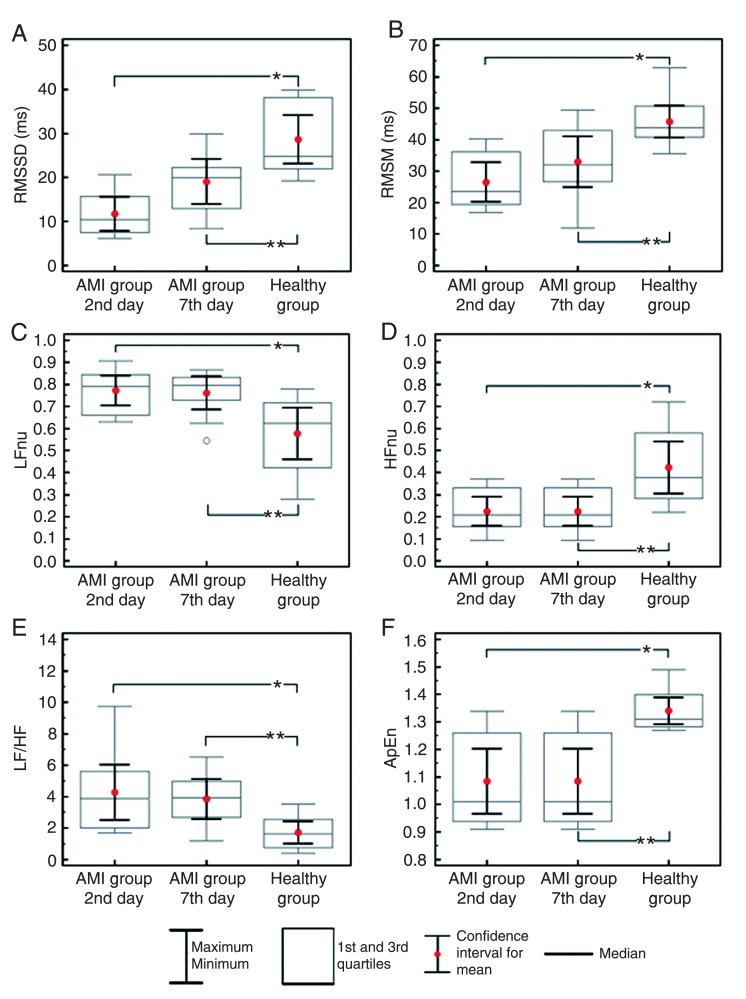
Figure 2. Box plot (median, confidence interval, 1st and 3rd quartiles, maximum and minimum) showing the results of the time domain analysis [RMSSD = square root of the sum of the squares of differences between RRi divided by the number of RRi in a determined time minus one (A); RMSM = square root of the sum of the squares of differences of individual values compared to the mean value divided by the number of RRi in a period (B)], the frequency domain analysis [LF = low frequency (C) and HF = high frequency (D) nu (normalized units), and LF/HF ratio (E)] and the nonlinear model analysis [ApEn = approximate entropy (F)], comparing the acute myocardial infarction (AMI) group on the 2nd and 7th day to the healthy group. *P < 0.05, AMI group on the 2nd day compared to the healthy group (Mann-Whitney nonparametric test); **P < 0.05, AMI group on the 7th day compared to the healthy group (Mann-Whitney nonparametric test).

Figure 2.