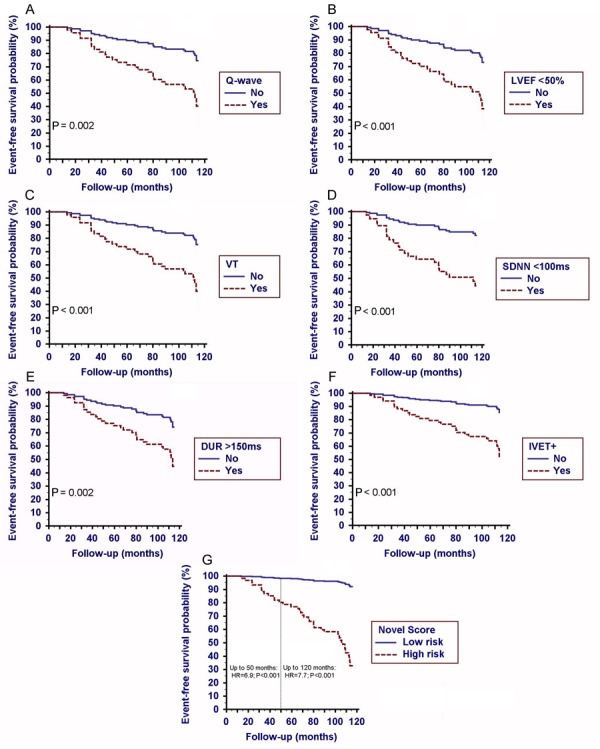
Figure 1. A, Kaplan-Meier event-free probability function of composite endpoint in univariate analysis for A, pathological Q-wave on 12-lead resting ECG (hazard ratio, HR=2.9; 95%CI=1.5-5.8; P<0.002); B, left ventricular ejection fraction [(LVEF<50%); HR=3.4; 95%CI=1.7-4.1; P<0.001]; C, ventricular tachycardia [(VT) HR=3.6; 95%CI=1.7-7.1; P<0.001]; D, 24-h standard deviation of normal RR interval [(SDNN<100 ms) HR=4.1; 95%CI=1.8-8.8; P=0.001]; E, vector magnitude-filtered QRS duration on SAECG [(DUR>150 ms); HR=3.0; 95%CI=1.5-5.9; P=0.002], and F, positive spectral turbulence on SAECG [(IVET+) HR=4.0; 95%CI=1.8-9.3; P=0.001]. G, Kaplan-Meier event-free probability function for composite endpoints according to follow-up time. High risk level: Novel score >1; low risk level: otherwise, see text for details.

