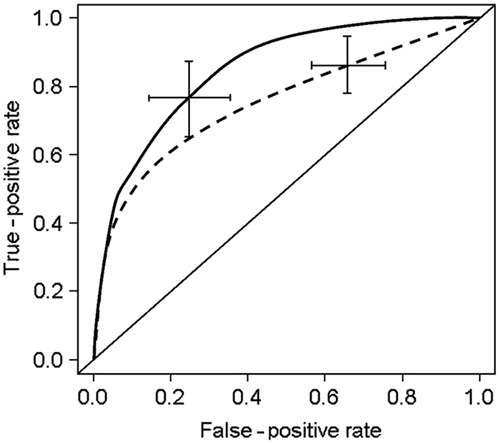
Figure 2. Receiver operating characteristic curve (ROC) output of 10,000 bootstrap procedures of novel (solid line) and Rassi score (dashed line). Lines are average ROC curves and error bars are 95% confidence interval. Note that the novel score [(means±SD) C-statistic: 0.89±0.03; continuous line] showed a non-inferior performance when compared to the Rassi score (C-statistic: 0.80±0.05; P<0.001 for non-inferiority; dashed line) (see text for details).