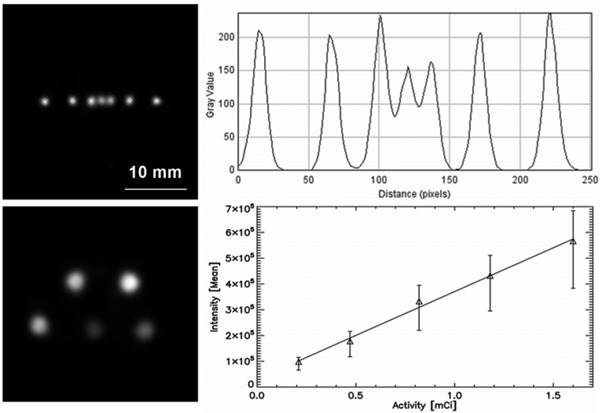
Figure 2. Spatial resolution and quantification. Upper panels, capillary tube phantom. Left: characteristic slice through the volumetric reconstruction of the phantom's emission. Right: intensity profile along a line intersecting the seven capillaries. It can be seen that all the capillary's emissions are well identified. Lower panels, quantification phantom. Left: characteristic slice through the volumetric reconstruction of the phantom's emission. Right: plot of the activity in the phantom versus mean intensity in the phantom.

