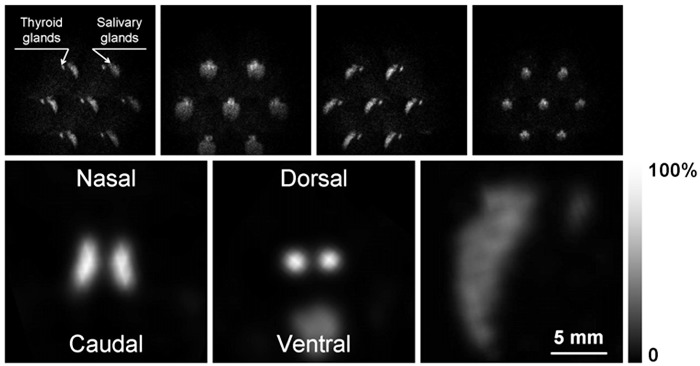
Figure 3. Thyroid images. Upper panels, sequence of 4 of the 16 projections obtained with the seven-pinhole imaging device of the mouse neck area, labeled with sodium pertechnetate. Lower panels, characteristic slices through the reconstructed volumetric model of the radioactive emission from the mouse thyroid and salivary glands along the three main axes, after 80 iterations.

