
Table 3. Serum fat, hepatic enzymes and HOMA-IR of the rats in each group.
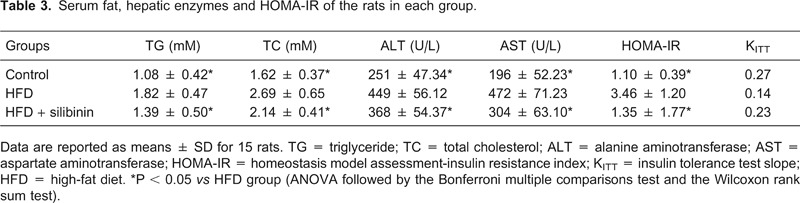
Data are reported as means ± SD for 15 rats. TG = triglyceride; TC = total cholesterol; ALT = alanine aminotransferase; AST = aspartate aminotransferase; HOMA-IR = homeostasis model assessment-insulin resistance index; KITT = insulin tolerance test slope; HFD = high-fat diet. *P < 0.05 vs HFD group (ANOVA followed by the Bonferroni multiple comparisons test and the Wilcoxon rank sum test).