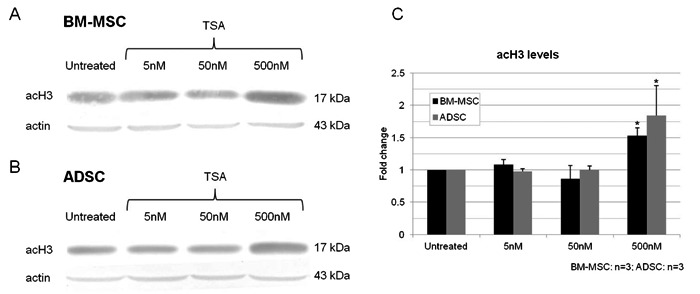
Figure 2. Analysis of histone acetylation in MSCs after 2 days of treatment with TSA (5, 50 and 500 nM). A,B, Western blot analysis of acH3 levels in cultured BM-MSCs (A) and ADSCs (B); an actin probe was used as a loading control. C, Quantitative analysis of relative levels of acH3 in cultured BM-MSCs and ADSCs. MSCs = mesenchymal stem cells; TSA = trichostatin A; BM-MSCs = bone marrow MSCs; ADSCs = adipose tissue stem cells. Data are reported as means ± SD. Asterisks just above SD bars indicate a statistically significant difference with respect to untreated cultures of BM-MSCs or ADSCs. *P < 0.05 (Student t-test).

