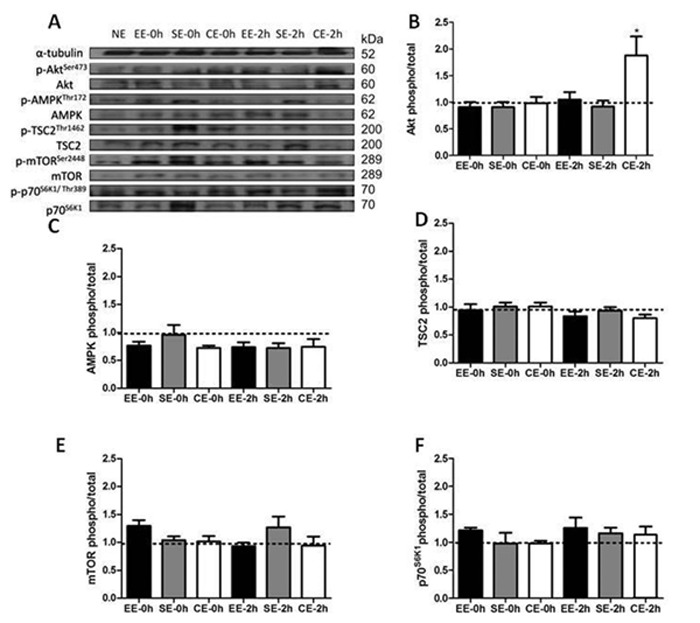
Figure 1. Phosphorylated/total ratio Akt, AMPK, TSC2, mTOR, and p70S6K1 protein expression for endurance exercise (EE; n = 6), strength exercise (SE; n = 6), and concurrent exercise (CE; n = 6) groups immediately after (0 h) and 2 h after exercise protocols. The traced line refers to the no exercise control group (NE; n = 6) (means ± SE). *P = 0.002 compared to the NE group [two-way ANOVA (F test = 4.406)].