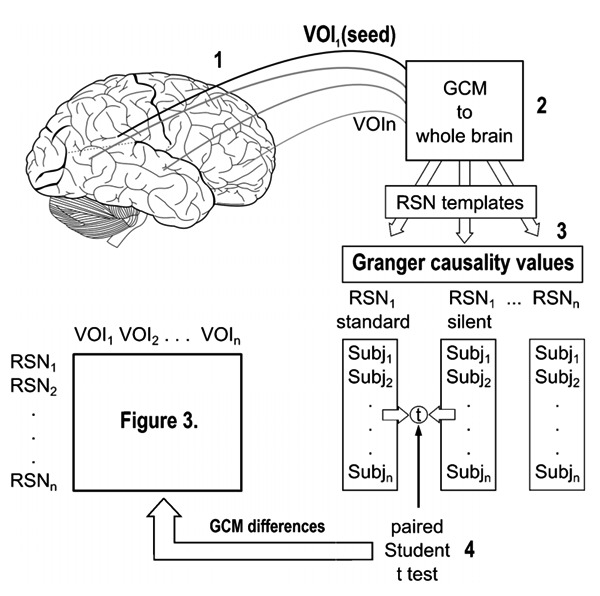
Figure 1. General scheme showing the approach of our data analysis. Numbers stand for 1 = seed definition based on between-group ICA differences; 2 = Granger causality values calculation across whole brain voxels; 3 = Granger maps and RSN templates overlapped; 4 = paired t-test for GCM differences between noise conditions and across subjects (see Figure 3). VOI = volume-of-interest; Subj = subject; RSNs = resting-state networks; GCM = Granger causality mapping.

