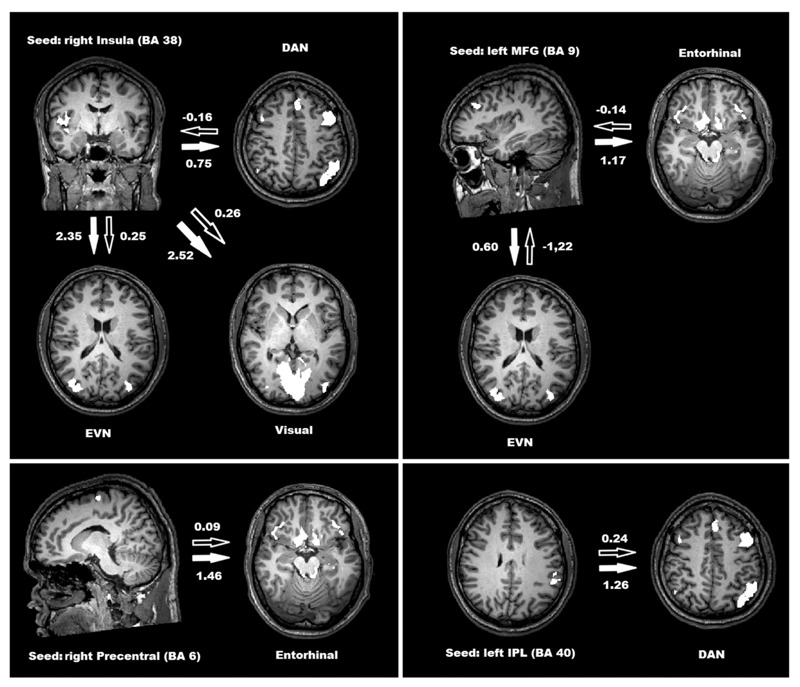
Figure 3. Significant Granger causality mapping (GCM) values from seed volume-of-interest to resting-state networks (P < 0.05, Student t-test). Black arrows show GCM values in standard acquisition and white arrows show GCM values in silent echo-planar imaging acquisition. DAN = dorsal attention network; EVN = extrastriate visual network; MFG = middle frontal gyrus; Entorhinal = entorhinal network; IPL = inferior parietal lobule; BA = Brodmann areas.

