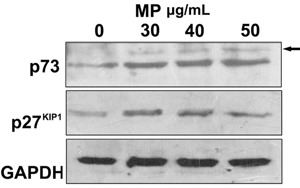
Figure 6. Western blot analysis of p73 and p27KIP1 expression by HeLa cells exposed to various concentrations of MP (0, 30, 40, and 50 μg/mL). Control cells were treated with 0.05% DMSO. Cells were harvested and proteins were separated by SDS-PAGE and transferred onto a PVDF membrane. Western blot analysis was performed using specific p27KIP1, p73 and GAPDH antibodies. Arrow indicates the nonspecific bands.

