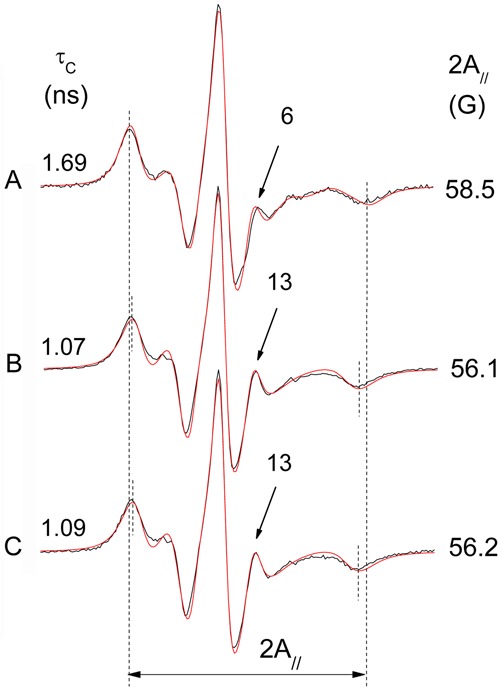
Figure 4. Experimental (black line) and best-fit (red line) EPR spectra of 5-DSA in erythrocyte ghost membranes: A, oxidized with 50 mM AAPH; B, control sample (not oxidized); C, a sample pre-treated with 100 µM 4-NC and then oxidized (50 mM AAPH). The EPR parameter 2A// represents the separation in magnetic-field units between the first and last resonance lines of the spectrum. The vertical lines indicate the 2A// for the oxidized sample (the total magnetic field scan range of the spectrum was 100 G). The values of both the 2A// and the rotational correlation time (τC) parameters (shown in the figure for each spectrum) were greater for the oxidized sample, indicating a reduction in molecular dynamics or increased molecular order. Another indication of this loss of probe mobility in the oxidized sample is the smaller relative intensity of the resonance line, which is indicated by an arrow (and intensity value) in each spectrum. The estimated experimental errors for 2A// and τC are 0.5 G and 0.2 ns, respectively. EPR: electron paramagnetic resonance; AAPH: 2,2′-azobis(2-aminopropane) hydrochloride; 4-NC: 4-nerolidylcatechol.

