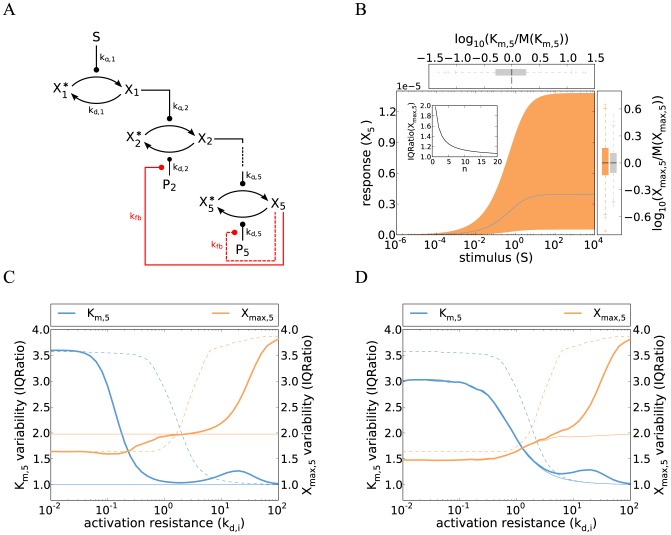
Figure 2. Cell-to-cell variability of kinase cascades with negative feedback.
A Schematic representation of the five-step cascade with negative feedback acting upstream (red, solid) or downstream (red, dashed).  either activates the phosphatase of the second or the fifth level. B Cell-to-cell variability simulations confirm that negative feedback eliminates the variability of the pathway sensitivity (concepts similar to Figure 1B). Strong feedback was assumed and simulations were performed using Eq. 9 (parameters same as in Figure 1B; Supplemental Table S1). Colored box plots represent the
  and
and  distribution of the feedback model, while gray box plots show the behavior of the reference feedback-less cascade (cf. Figure 1B). The inset shows that increasing the feedback cooperativity parameter
  (Eq. 8) decreases
  variability, measured as IQRatio (cf. Figure 1C). C–D Negative feedback abrogates the trade-off in
  and
and  invariance. Cell-to-cell variability simulations (similar to panel B) were repeated for various parameter configurations for models with upstream feedback (C) or downstream feedback (D): activation resistances in the cascade were tuned by simultaneously changing the phosphatase rate constants
  (x-axis). The variabilities of
  and
and  were analyzed using the IQRatio as in Figure 1C, and similar results are obtained using the coefficient of variation (Figure S2).
  was defined as the stimulus for a half-maximal pathway activation. The behavior of a feedback model with limited feedback strength (
 ; thick, solid lines) is compared to a feedback-less model (
 ; thin, dashed lines) and to a model with very strong feedback
  ; thin, solid lines). Simulations for moderate feedback strength (thick lines) were performed by numerically integrating the ODE systems (Eqs. 8 and 12), while the strong feedback calculations (thin solid lines) were done using analytical approximations (Eqs. 9 and 13).

