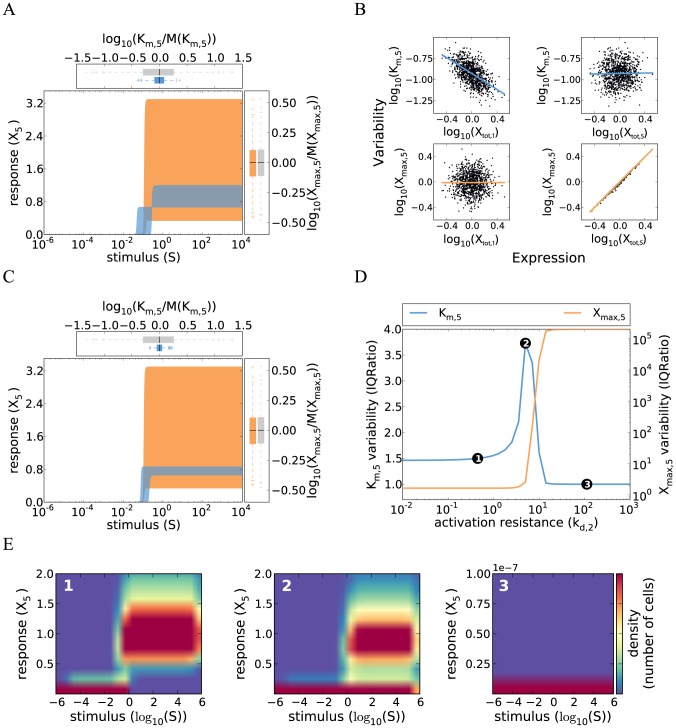
Figure 3. Cell-to-cell variability of kinase cascades with distributed ultrasensitive switching.
A Simulations of a cascade with distributed ultrasensitive switching and low activation resistance shows a steep response with little variability in  (defined as the stimulus for a half-maximal pathway activation). The simulations of the five-step cascade were performed by iteratively applying the Hill equation describing the steady state of each level (similar to Eq. 14). The concepts and parameter values correspond to Figure 1B, with a Hill coefficient
  (Supplemental Table S1). Colored box plots represent the
  and
and  distribution of the ultrasensitive model, while gray box plots show the behavior of the reference gradual cascade (cf. Figure 1B). B
 is strongly controlled by the first kinase concentration, whereas
  primarily responds to fluctuations in the terminal kinase (concept similar to Figure 1D). C Simulations of a cascade with distributed ultrasensitive switching show that the threshold variability can be reduced by coregulating the first level kinase (
 ) and second level phosphatase (
 ) concentrations. Correlation was modeled by introducing a proportional relationship between both concentrations. D–E The variabilities of
  and
and  were analyzed using the IQRatio as in Figure 1C, but plotted against changes in the kinetic parameter value for only the second level phosphatase (
 ). Similar results are obtained using the coefficient of variation as a measure of variability (Figure S3). The markers 1–3 correspond to the respective dose-response density plots shown in E. A high density (red) corresponds to a high number of cells showing a particular stimulus-response relationship. Three modes of variability are visible in E: 1) for low resistance values, the variability in
  is low and all cells are able to respond to stimulation; 2) the variability increases at intermediate resistance levels, because only a fraction of the cells respond while the remaining cells do not even for high stimulus values; 3) in case of a high activation resistance no cell is able to respond.

