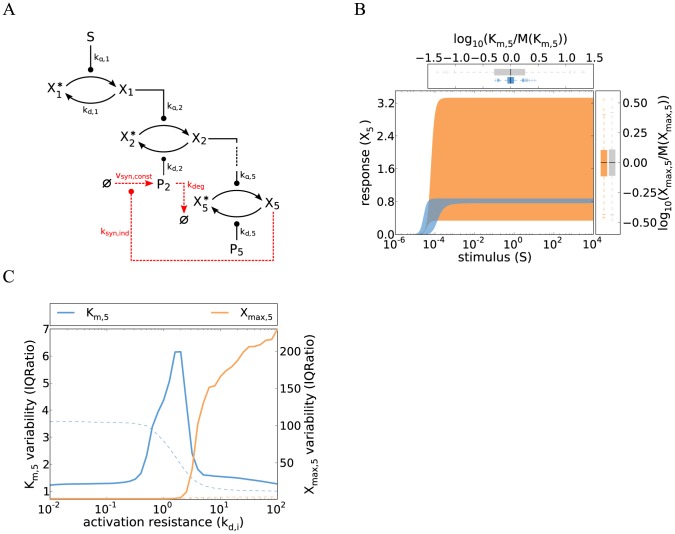
Figure 5. Cell-to-cell variability of cascades with a localized switch at the terminal level and basal transcriptional feedback.
A Schematic representation of the five-step cascade with an ultrasensitive terminal step and basal transcriptional feedback. Assuming fast pathway dynamics and slow expression dynamics (time-scale separation), the system can be considered to exist in two states: at basal levels of stimulus,  induces the expression of the second level phosphatase
  (Eq. 18). Upon acute stimulation the pathway responds rapidly but the expression kinetics of the phosphatase are too slow to establish a significant feedback regulation (Eq. 19). B Simulations of a cascade with a localized switch at the terminal level and basal transcriptional feedback show a reduced variability when compared to the ultrasensitive model without basal transcriptional feedback shown in Figure 4A. The concepts and parameter values correspond to Figure 1B, and the simulations were performed numerically integrating the ODE system given by Eqs. 16–19, with a Hill coefficient
  , a basal stimulus of
  , a basal synthesis rate
  , an
, an  -induced synthesis rate constant
  , and a degradation rate
  (Supplemental Table S1). Colored box plots represent the
  and
and  distribution of the basal transcriptional feedback model, while gray box plots show the behavior of the reference gradual cascade (cf. Figure 1B). C Variabilities of
  (defined as the stimulus for a half-maximal pathway activation) and
  were analyzed using the IQRatio, and the activation resistance was tuned by varying several phosphatase rate constants (
 –
–  , thick, solid lines). The variability of the gradual model is shown for comparison (thin, dashed lines). The variant with basal transcriptional feedback is able to strongly reduce the variability in
  for low activation resistance values when compared to the single-switch model without feedback (cf. Figure 4B). Similar results are obtained using the coefficient of variation as a measure of variability (Figure S5).

