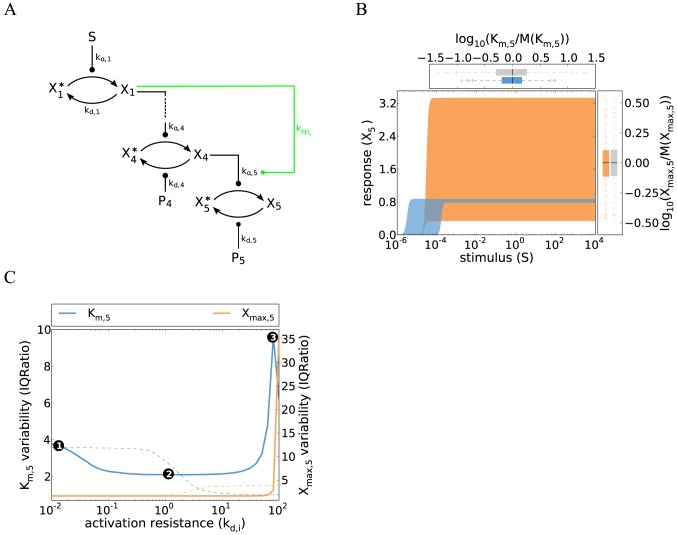
Figure 6. Cell-to-cell variability of cascades with coherent feedforward regulation.
A Schematic representation of the five-step cascade with a coherent feedforward loop: the  -mediated phosphorylation of
  is positively regulated by the kinase
  (see main text). B Simulations of a cascade with a coherent feedforward loop show reduced variability when compared to the single-switch model without feedforward regulation (Figure 4A). The concepts and parameter values correspond to Figure 1B, and the simulations were performed by iteratively applying Eqs. 16 and 20, with a Hill coefficient
  and
and  (see Supplemental Table S1). Colored box plots represent the
  and
and  distribution of the feedforward model, while gray box plots show the behavior of the reference gradual cascade (cf. Figure 1B). C The variabilities of
  (defined as the stimulus for a half-maximal pathway activation) and
  were analyzed as a function of the activation resistance by varying several phosphatase rate constants (
 –
– , thick, solid lines), and compared to a gradual model (thin dashed lines). Feedforward regulation plays no role at low activation resistances (point 1), but reduces the variability at intermediate activation resistances (point 2; see main text). High variability arises at high resistances, because not all cells reach the threshold for full
  activation (point 3). Similar results are obtained using the coefficient of variation as a measure of variability (Figure S6).

