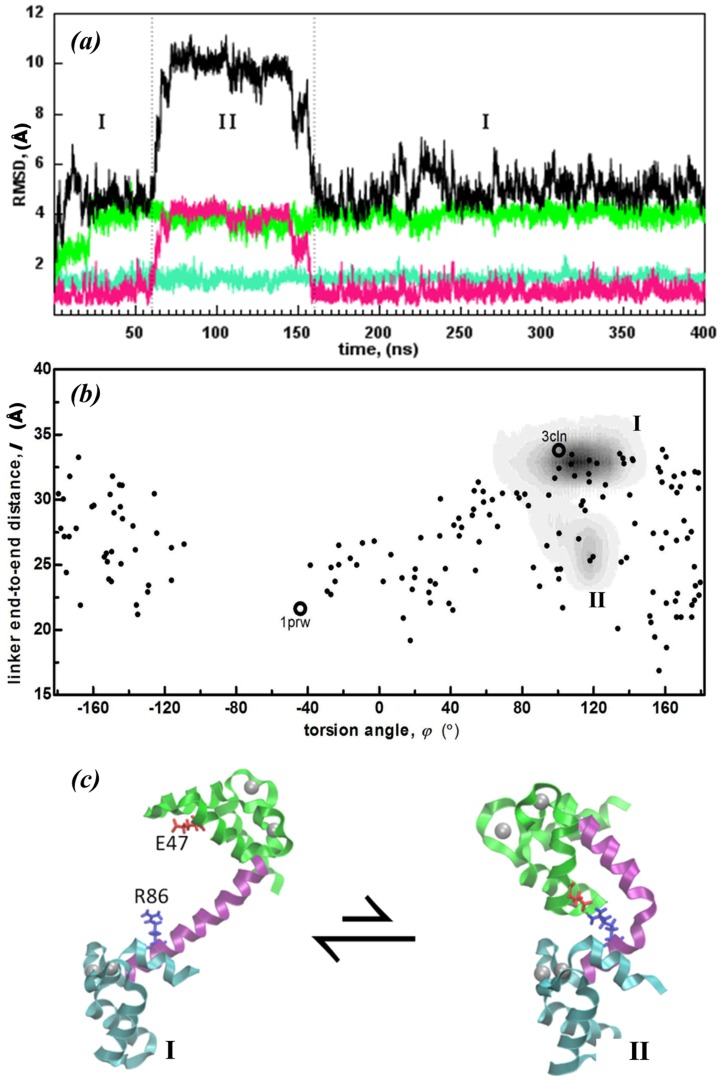
Figure 5. Conformations sampled by  system. (a) RMSD of subunits depicted schematically in figure 1 (same color code) as well as the total structure (black) reveals that the relative orientations of the domains change substantially during the 400 ns trajectory.
The two major conformations sampled are depicted by regions I, and II. (b) (φ,l) plots of  (gray shaded areas) overlaid on experimental structures as in Figure 2; regions I and II depicted in (a) are easily distinguished. (c) Sample structures denoting the two regions in this run.

