
Fig. 3.
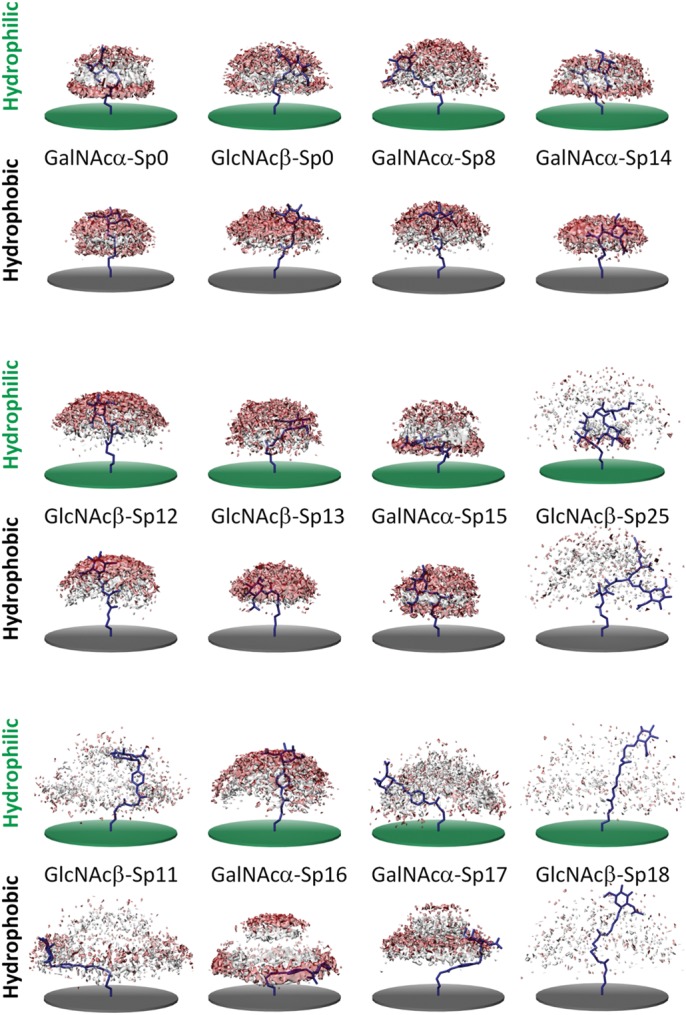
Isodensity surfaces depicting the spatial distributions of the C1 (light gray) and C4 (red) glycan atoms from 5,000 snapshots extracted from the MD simulations. A single 3D structure of the glycan and linker, extracted from each MD simulation, is shown (stick, navy blue).