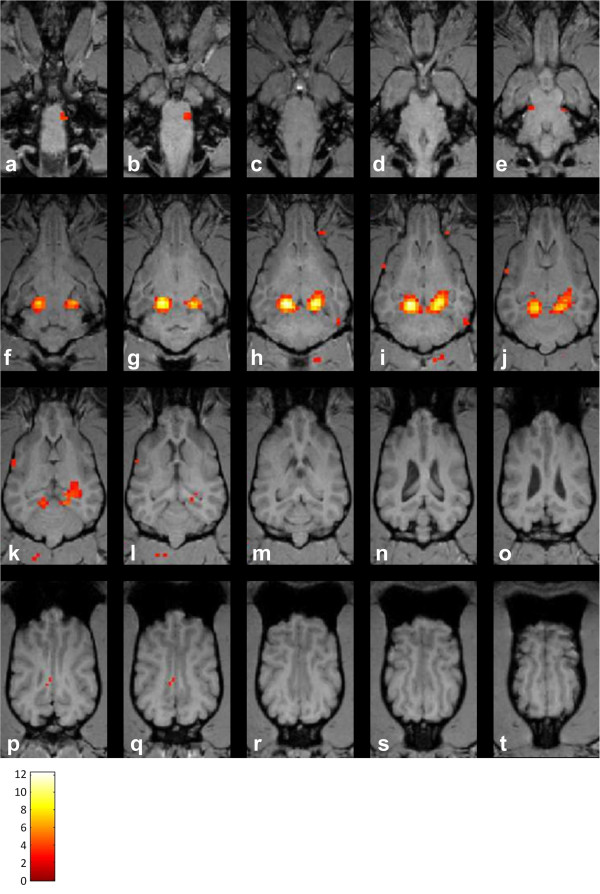
Figure 1.
Multiple dorsal sections from the brain of one dog with superimposed BOLD-activation following auditory stimulation (a-t). T2* weighted functional data were obtained using sequence 1 to identify voxels responding to auditory stimulation. These voxels were afterwards superimposed on T1 weighted anatomical images of the subject (slice thickness between adjacent dorsal sections 2 mm) as colored pixels. The colorbar indicates the t-values of the activated voxels. The pictures show the most significant activation in the region of the caudal colliculi (slices f-k) followed by the medial geniculate nuclei (slices h-k). Few activated voxels were found in the cortex and other regions of the brain. This activation pattern is representative for all functional data obtained with sequence 1.

