
FIGURE 2.
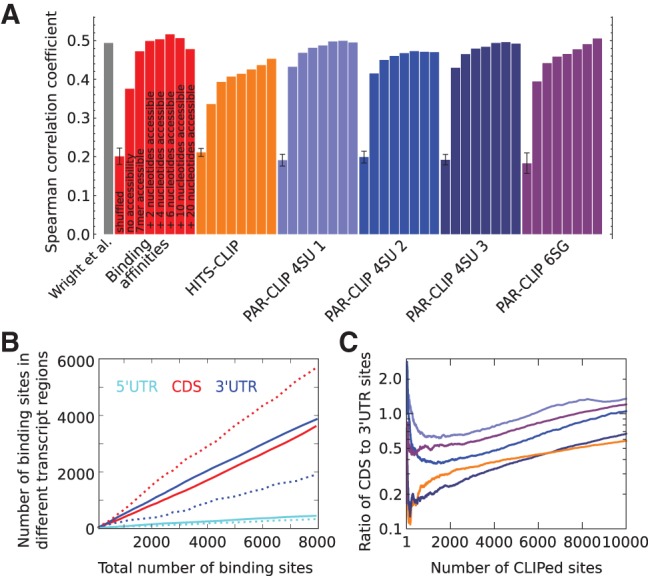
Predictive power of GLD-1 binding motifs. (A) Spearman correlation coefficient of RIP-Chip enrichment (Wright et al. 2011) with expected number of binding sites in whole transcripts (see Materials and Methods) for all GLD-1 binding motifs derived from various CLIP experiments (indicated in the labels below the x-axis). The Spearman correlation coefficient between RIP-Chip enrichment and transcript scores computed by Wright et al. (2011) is shown in the first column. For each weight matrix, 10 permutations were generated, maintaining the relative nucleotide frequencies within columns. The first bar in a colored block corresponding to one motif shows the average correlation coefficient obtained for the 10 randomized weight matrices. For each individual motif, additional columns show the Spearman correlation coefficient without and upon inclusion of the probability for a 7-mer, 9-mer, 11-mer, 13-mer, 17-mer, or 27-mer centered on the binding site to be accessible, calculated with RNAplfold (Bernhart et al. 2006; see Materials and Methods). (B) Number of predicted binding sites in 5′ and 3′ UTRs and CDSs in dependence of the total number of predicted sites using the GLD-1 binding model with the motif inferred from binding affinities without (dashed lines) and with inclusion of the probability for a 13-mer to be accessible (solid lines). (C) Ratio of CLIPed sites in CDSs to UTRs in five CLIP libraries (color code same as in A) sorted by the number of reads of CLIPed sites.