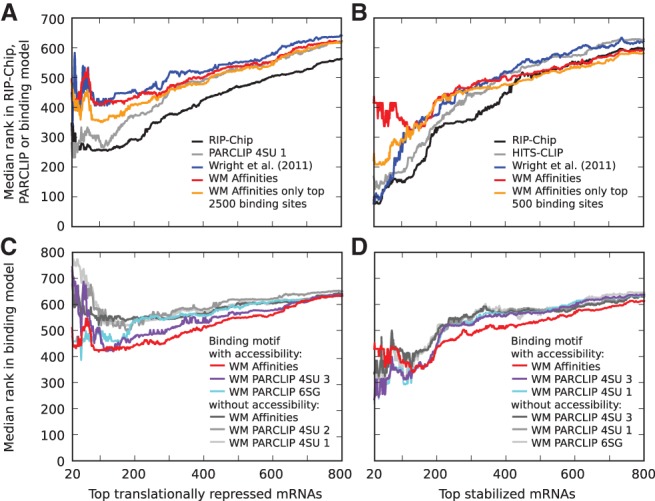
FIGURE 4.

Translational repression and stabilization in target transcripts. Median ranks in different data sets and computational models of (A,C) the transcripts whose translation is most strongly inhibited (translation rate was estimated as the ratio of the fraction of polysomal to total mRNA in wild-type worms compared with this fraction in gld-1 mutants) and (B,D) the transcripts that undergo the strongest stabilization (estimated as the ratio of mRNA levels in wild-type gonads compared with gld-1 mutant gonads). (A,B) Experimental measurements, RIP-Chip enrichment (black), and total number of CLIP reads per transcript (gray) better explain functional responses than computational predictions. For clarity, only the curves for the most predictive CLIP samples, which were the iPAR-CLIP 4SU 1 and HITS-CLIP, respectively, are shown. The computational models shown are those from Wright et al. (2011) (blue) and our biophysical GLD-1 binding model (red) that used the sequence specificity inferred from binding affinities and including the probability for accessibility of a 13-mer. The orange curve corresponds to the same biophysical model, but the expected number of sites per transcript was computed only based on the indicated number of highest affinity sites. The best improvement in the prediction of (A) translational inhibition was achieved with a cutoff of ∼2500 binding sites, while (B) a cutoff of ∼500 binding sites was best for stabilization. (C,D) Prediction of functional target transcripts is improved upon inclusion of the probability that sites are accessible. For clarity, shown are only the three best-performing binding motifs for each case.
