FIGURE 2.
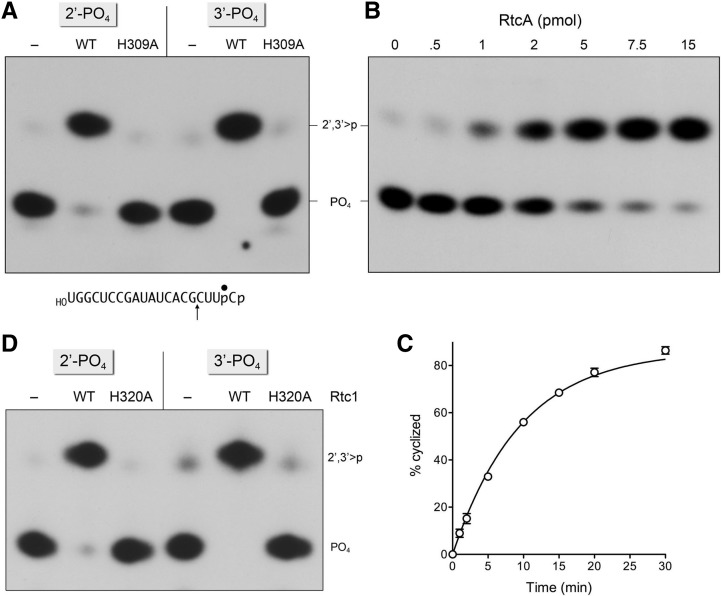
RtcA cyclizes a 2′-phosphate end. (A) Reaction mixtures (10 µL) containing 50 mM Tris-HCl (pH 7.4), 10 mM MgCl2, 2 mM DTT, 100 µM ATP, 20 nM 20-mer RNA2′p (2′-PO4) or RNA3′p (3′-PO4) substrate (depicted at bottom with the 32P label denoted by •), and either no enzyme (lanes –) or 1.5 µM wild-type E. coli RtcA or mutant RtcA-H309A were incubated for 30 min at 37°C. The reactions were quenched with EDTA. The products were digested with RNase T1 and then analyzed by urea-PAGE. An autoradiogram of the gel is shown. The terminal phosphorylation states of the 32P-labeled RNase T1 fragments are indicated at right. (B) Reaction mixtures (10 µL) containing 50 mM Tris-HCl (pH 7.4), 10 mM MgCl2, 2 mM DTT, 100 µM ATP, 20 nM (0.2 pmol) 20-mer RNA2′p (2′-PO4) substrate, and RtcA as specified were incubated for 30 min at 37°C. (C) A reaction mixture (70 µL) containing 50 mM Tris-HCl (pH 7.4), 10 mM MgCl2, 2 mM DTT, 100 µM ATP, 20 nM 20-mer RNA2′p (2′-PO4), and 1.5 µM RtcA was incubated at 37°C. Aliquots (10 µL) were withdrawn at the times specified and quenched immediately with SDS and EDTA. After phenol-chloroform extraction, the mixtures were digested with RNase T1 and analyzed by PAGE. The extent of cyclization is plotted as a function of reaction time. Each datum is the average of three separate experiments ±SEM. A nonlinear regression curve fit of the data to a one-phase association (executed in Prism) is shown. The apparent rate constant for 2′-phosphate cyclization was 0.1 ± 0.003 min−1. (D) RNA 2′-phosphate cyclase activity of human Rtc1. Reaction mixtures (10 µL) containing 50 mM Tris-HCl (pH 7.4), 10 mM MgCl2, 2 mM DTT, 100 µM ATP, 20 nM 20-mer RNA2′p (2′-PO4) or RNA3′p (3′-PO4) substrate, and either no enzyme (lanes –) or 1.5 µM wild-type human Rtc1 or mutant Rtc1-H320A were incubated for 30 min at 37°C. The reactions were quenched with EDTA. The products were digested with RNase T1 and then analyzed by urea-PAGE. An autoradiogram of the gel is shown.

