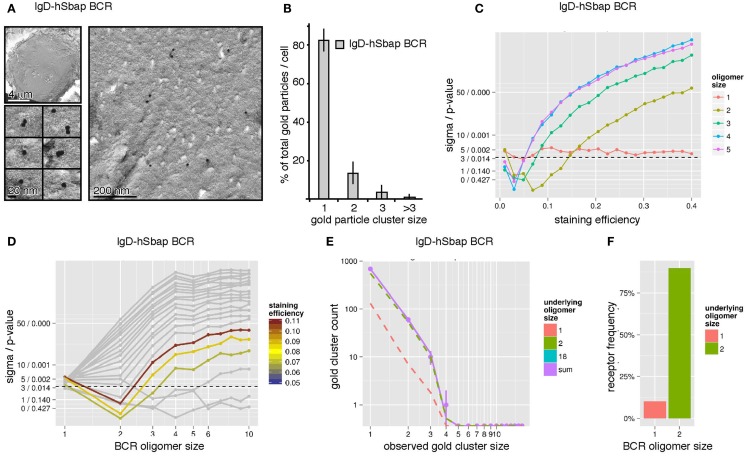
Figure 5.
The IgD-hSbap BCR mutant forms mainly BCR dimers on the surface of B cells. (A) IgD-hSbap BCR mutant-expressing J558L cells were immuno-gold stained and analyzed as in Figure 4A. (B) 83% of the gold particles were monomeric, 13% formed dimers, and 4% were present in clusters of sizes larger than 2. (C) The observed gold particle cluster size distribution was simulated for different BCR staining efficiencies (x-axis) and different underlying BCR oligomer sizes (color scale). The sigma/p-values for the statistical analysis of each simulation set are given on the y-axis. BCR dimers with a staining efficiency of 8% are identified as the most likely explanation for the observed gold cluster distribution. (D) Simulations were performed as in (C). Assuming a staining efficiency of approximately 8% (color coding), sigma/p-values (y-axis) are plotted for the different BCR oligomer sizes (x-axis). (E) Gold cluster counts (dots with error bars) compared to prediction of best fitting model (continuous line). The number of counts originating from monomers and dimers are shown as dashed lines, indicating that the observed distribution is dominated by BCR dimers. (F) A model with BCR monomers and dimers was fitted to the data, predicting that 90% of all receptors are part of dimers, 10% are monomers.

