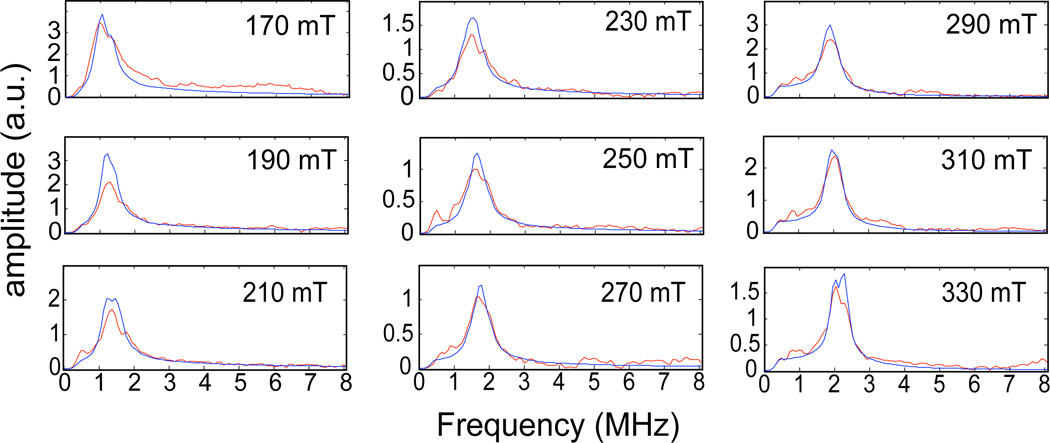
Figure 3.
The magnetic field dependence of the ESEEM spectra obtained by dividing time domain ESEEM collected for the TauD samples treated with α-KG and perdeuterated taurine by identical data for the TauD samples treated with α-KG and natural abundance taurine. Each plot is labeled with the field position at which the data were collected. The Hamiltonian model used to calculate the simulated spectra (blue) included coupling with two deuterons. The Hamiltonian parameters used in the simulation are provided in the captions for Figures 1 and 2.

