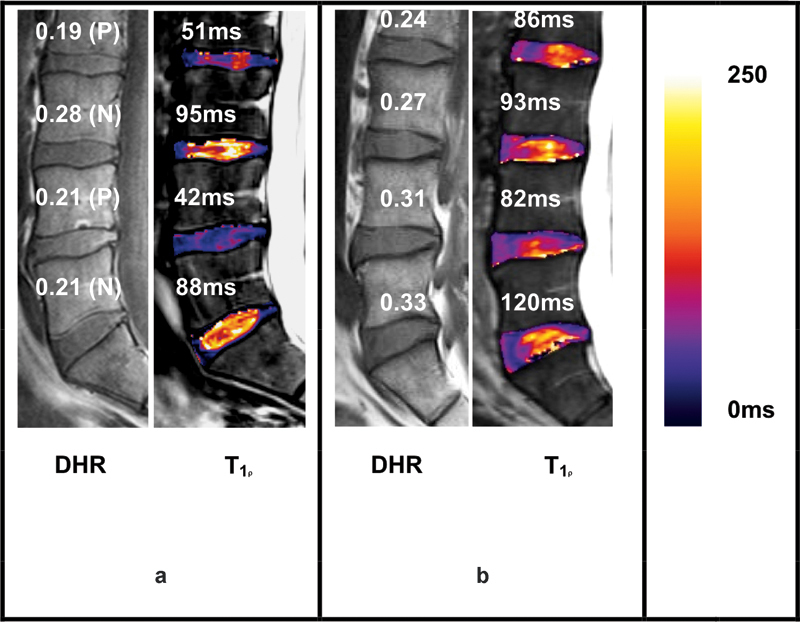
Fig. 2.

Representative T-1-rho (T1ρ) maps (in color) corresponding to T1-weighted magnetic resonance images (grayscale) of a patient with low back pain (a) and an asymptomatic normal volunteer (b). Listed above each disk are its disk height ratio (DHR) and presence of pain (P) or no pain (N) as determined by diskography and corresponding average T1ρ value in the middle third of the disk (nucleus pulposus region). The color scale on the right indicates T1ρ values from 0 to 250 milliseconds.
