
Figure 2.
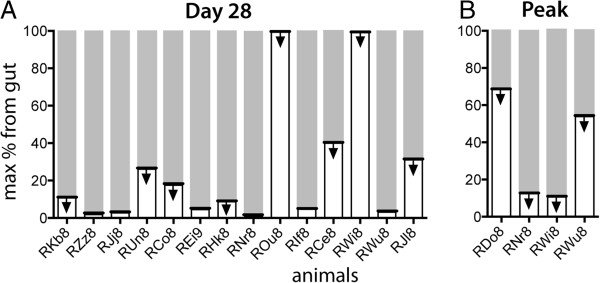
The highest possible contribution of gut to viral load. A. On day 28 (white part of the bar), estimated from the difference in WT content in plasma and rectal biopsy; B. Analysis of the proportion of WT virus at peak viral load also suggests a low contribution of virus from the gut in the few animals that have escape at this time. The arrows indicate that all estimates are of the maximum contribution of the gut, and the data are equally compatible with any lower figure.