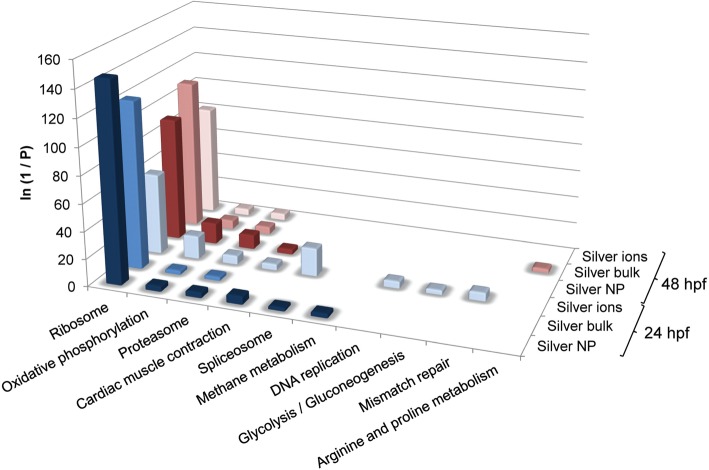
Figure 3.
KEGG pathways over-represented in differentially expressed gene lists following exposure of zebrafish embryos to silver. Over-representation analysis was conducted for gene lists differentially expressed between each treatment and its control (adjusted P values <0.05), after 24 and 48 h of exposure, using the list of all expressed genes as a background, within DAVID. The full data set for KEGG pathway over-representation is presented in SI, File S5.

