
Figure 3.
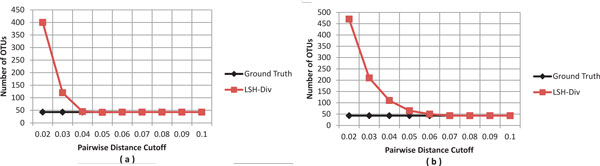
Analysis of synthetic dataset for number of OTUs. The graphs show lineage-through-time curves generated by LSH-Div algorithm on synthetic dataset with sequence set containing up to (a) 3% and (b) 5% sequencing errors. The parameter setting used by LSH-Div algorithm to obtain these results is k = 30, w-mer = 3.