
Figure 1.
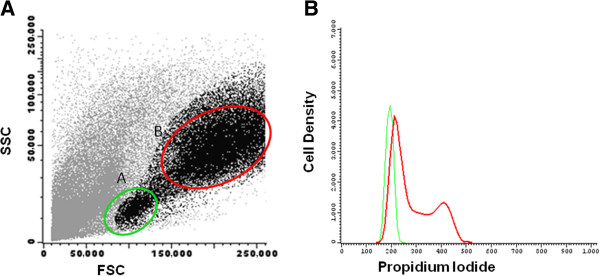
Cells displaying increased forward scatter and side scatter light dispersion properties correspond to proliferating cells. Left: Bivariate dot plot histogram illustrating mononuclear cell (MNC) culture after phytohemagglutinin (PHA) stimulation, displaying two distinct cell populations: A) MNC with low forward scatter (FSC) and side scatter (SSC) light dispersion properties and B) MNC with increased FSC and SSC properties. Right: Density histogram illustrating the DNA content of MNC from population A (green) and B (red), measured after propidium iodide staining, and proving that cells with increased FSC and SSC are actively proliferating.