
Figure 1.
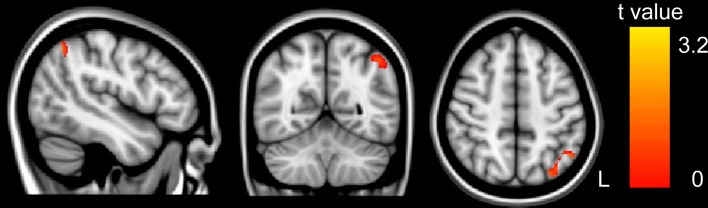
The correlation between GM volume and WISC-RC arithmetic scores. Positive correlation between GM volume and WISC-RC arithmetic scores in the left IPS. The location of the significantly correlated cluster was shown in red-yellow. The color intensity represents the T-statistical value at the voxel level. The statistical threshold was set at p < 0.05 using the AlphaSim correction (with a threshold of p < 0.01 and a minimum cluster size of 76 voxels). L, left. There were no negative correlations between GM volume and arithmetic score.