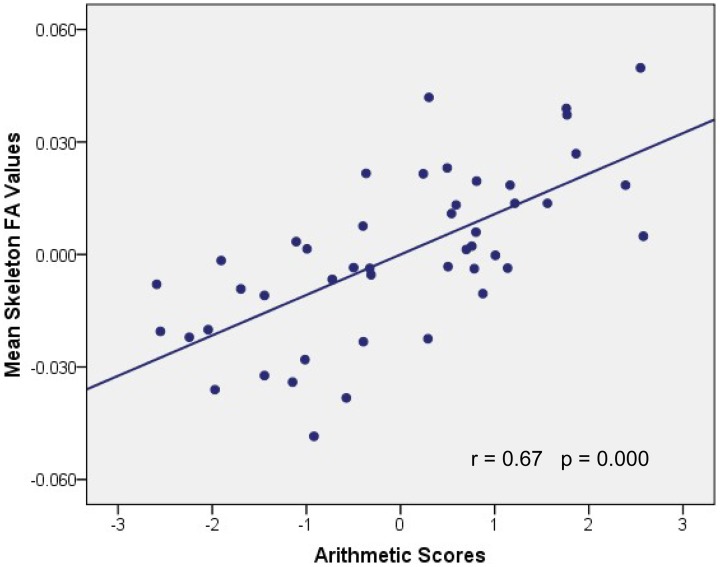
Figure 4.
Association between mean FA values and WISC-RC arithmetic scores. Parietal residual plot with trend lines depicting the correlation between residuals in multiple regression analysis investigating the association between the mean FA values in the WM clusters and the WISC-RC arithmetic scores for entire cohort, after correction of full-scale IQ, age, and gender. r denotes the partial correlation coefficient.

