
Figure 3.
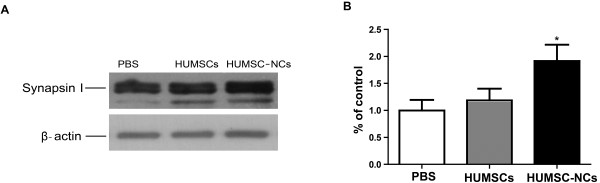
HUMSC-NC transplantation increased synapsin I level. (A) Representative Western blots for synapsin I protein expression in hippocampus. (B) Quantification of the Western blot for synapsin I. The densitometry of synapsin I bands was first normalized to the loading control β-actin. The percentage of the expressions of synapsin I in the HUMSC- or HUMSC-NC-treated group relative to that in the PBS-treated group was then calculated. The scanned image of Western blot was analyzed with the software Image J. Data were presented as mean ± SEM. *P < 0.05, HUMSC-NC-treated group versus PBS-treated group.