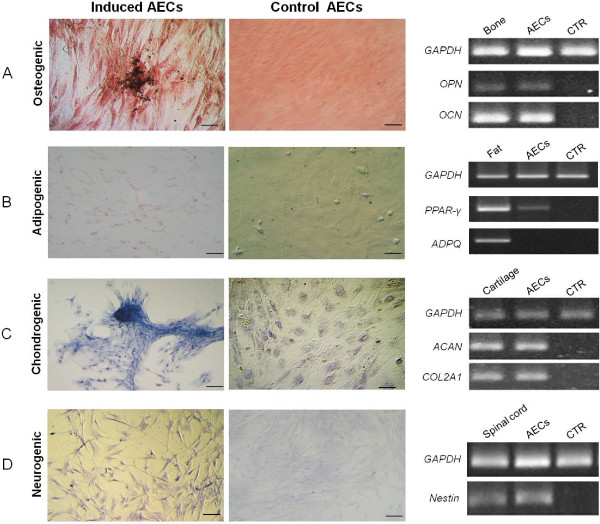
Figure 4.
Staining of differentiated and control undifferentiated feline AECs and respective molecular expression. A) von Kossa staining after osteogenic induction and RT-PCR analysis of osteopontin (OPN) and osteocalcin (OCN). B) Oil Red-O positive cytoplasmic neutral lipids after adipogenic induction and RT-PCR analysis of PPAR-γ and adiponectin (ADPQ). C) Alcian blue staining after chondrogenic induction and RT-PCR of aggrecan (ACAN) and collagenase (COL2A1). D) Nissl staining after neurogenic induction and RT-PCR of nestin. Magnification 20×; scale bar = 20 μm. GAPDH was employed as a reference gene. Bone, adipose tissue, cartilage and spinal cord were used as positive controls. AECs, amniotic epithelial cells.

