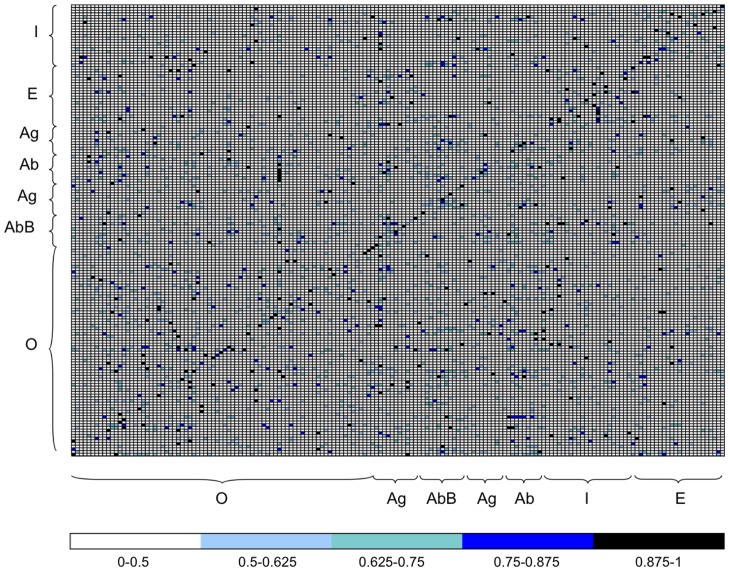
Figure 1. Normalized Interaction Index (NII) matrix for the complete dataset of 168 proteins.
The matrix is ordered with the experimental complexes lying on the trailing diagonal. Protein structures corresponding to columns and rows are grouped in functional classes: Enzymes (E), Inhibitors (I), Antibody (Ab), Antigen (Ag), Bound Antibody (AbB), Others (O). Each entry of the matrix corresponds to the NII value computed for the corresponding pair of proteins (receptor on the y-axis and ligand on the x-axis). High interaction scores (between 0.7 and 1, blue and black in the color scale) indicate a high interaction probability. Interaction scores are computed using knowledge of the experimental interfaces. The plot corresponds to an  . In the color bar the intervals correspond to
  values, where the upper bound is included in each interval. Rows and columns are labeled with protein names in Figure S1 in Text S1.

