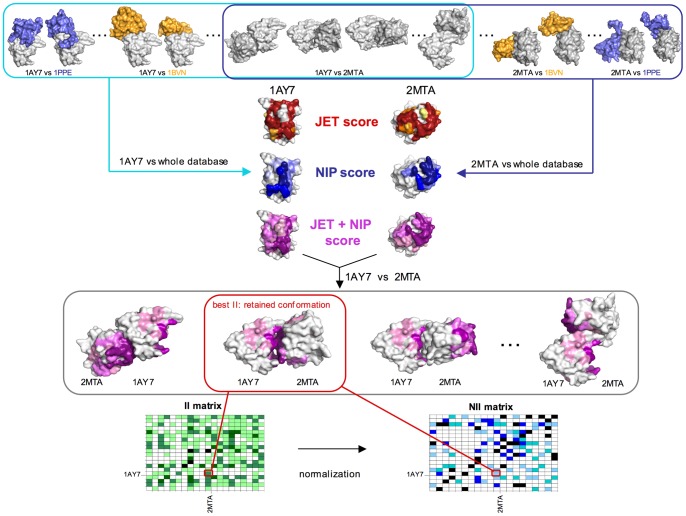
Figure 3. The protocol.
The protocol is based on docking calculations and JET predictions and produces an interaction matrix for the proteins in a database. Here, two protein structures, the receptor 1AY7 and the ligand 2MTA, are analyzed. The first step consists in cross-docking 1AY7 and 2MTA respectively, against all structures in the database (see cyan box for 1AY7 and blue box for 2MTA). A structure will be crossed dock against another in several conformations (from 100000 up to 450000, depending on the size of the proteins). In the schema, 1AY7 and 2MTA are also docked one against the other (see intersection between blue and cyan boxes). As a result of the cross-docking, a NIP score is associated to each protein leading to the prediction of an interaction site (color range from light blue to dark blue, corresponding to weak and strong signals respectively). In parallel, each protein is analyzed with JET, a JET score is associated to it and leads to the prediction of an interaction site based on evolutionary information (color range from yellow to red, corresponding to weak and strong signals respectively). JET and NIP scores are finally combined to obtain a JET+NIP score for each protein structure (color range from light pink to deep purple, corresponding to weak and strong signals respectively). Then, for each docked conformation, the JET+NIP score is combined to the corresponding energy value (to compute the FIR) to discriminate the best conformation of 1AY7 and 2MTA among all possible conformations computed by cross-docking (grey box, corresponding to the intersection of cyan and blue boxes - notice that the orientation of 1AY7 is the same in all conformations represented in the box). For the full dataset, the FIR values of the best conformation computed for each pair of proteins are recorded in the  matrix. Notice that the schema describing the computation for 1AY7 and 2MTA leads to one entry of the matrix. Finally, a normalization step produces the NII matrix used to discriminate potential partners.

