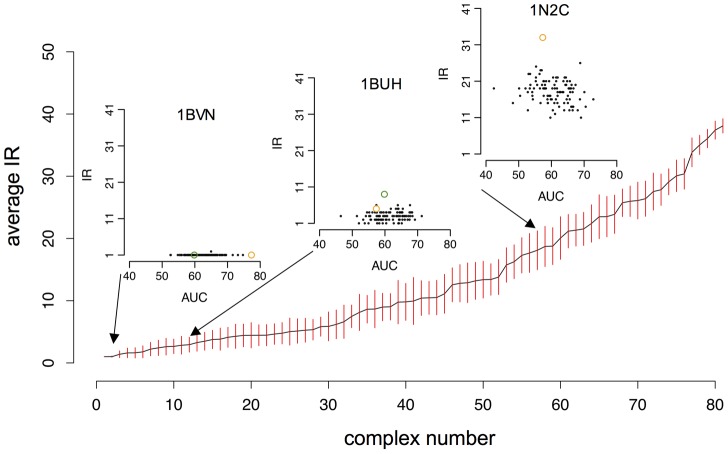
Figure 4. Robustness of the native complex predictions with respect to the environment composition.
Partner predictions are based on predicted interfaces. Average Interaction Rank (IR) of the true partners is computed over 100 random sets made of 40 proteins each (with error bars in red). The 84 complexes are ordered with respect to their increasing average IR value. For three of the 84 complexes (1BVN, 1BUH, 1N2C), detailed plots show the IR of the complex within each of the 100 random sets and the corresponding AUC value (black dots); green dots correspond to the IR of the complex computed over the Mintseris dataset; orange dots correspond to the IR of the complex computed over complexes in the same functional class. Note that the absence of the green dot on the 1N2C plot corresponds to a too large IR ( ) of the complex. See Table S2 in Text S1 for the names of complexes ranked on the
  -axis. See Figure S55 in Text S1 for robustness of predictions based on experimental interfaces.

