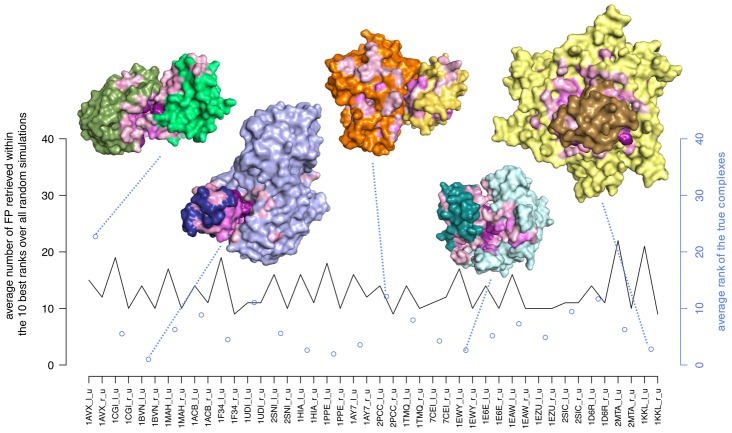
Figure 6. Average IR for true Enzyme-Inhibitor complexes and number of false positives.
For each protein, we plot as false positives (FPs, black curve) the number of partners (excepted the true one) showing an average IR  , where the IR is computed over 100 random sets of 20 complexes selected from the set of 46 Enzyme-Inhibitor proteins. The cyan dots indicate the average IR of the true partner. A dot corresponds to a complex. For five complexes, conformations associated to the best FIR are represented with different colors: 1AVX (green), 1BVN (blue), 2PCC (orange), 1EWY (cyan), 1KKL (yellow). All residues with a JET+NIP score
  display interaction propensity and are colored in a color range going from light pink (weak signal) to deep purple (strong signal). 2PCC: the JET+NIP signal is distributed all around the receptor surface enabling different possibilities for the ligand to bind. The predicted interacting site covers only the 5% of the true binding site of the receptor. 1AVX: the predicted receptor binding site shares no residue with the real interaction site, leading to a bad prediction. 1BVN and 1KKL: despite the important size of the receptors 1BVN (496 residues) and 1KKL (3 chains of 205 residues each), corresponding binding sites are well predicted and true partners are identified with
  and
and  respectively.

