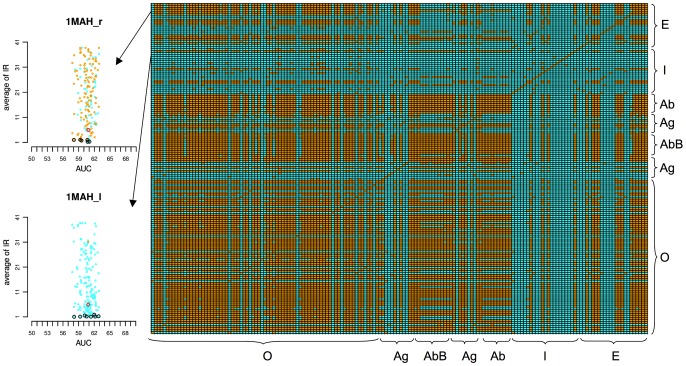
Figure 7. Species represented in the Mintseris Benchmark 2.0.
Right: matrix reporting whether (orange entries) or not (cyan entries) any two protein structures of the Mintseris Benchmark 2.0 are represented by a common species at  sequence identity. Each line in the matrix represents a protein and the matrix is not symmetric (see Methods). The proteins are ordered by functional classes: Others (O), Antibody (Ab), Bound Antibody (AbB), Antigens (Ag), Inhibitors (I) and Enzymes (E). The
  -axis follows the same order as the
  -axis, from bottom to top. Compare with the matrices of Figures S74 and S75 in Text S1, based on homology computed for
  and
and  sequence identity respectively. The matrix labelled with protein names is reported in Figure S76 in Text S1. Left: an example of IRs analysis where the species information reported in the matrix on the right is plotted. Colors in the two lines of the matrix corresponding to the Enzyme-Inhibitor complex 1MAH are mapped on the dots of the plots for the receptor 1MAH_r and the ligand 1MAH_l (see legend of Figure 5 for the plots description). The black contour line on some of the proteins identifies bottom black dots in the IR analysis of Figures S38–S51 in Text S1. The red contour identifies the true interacting partner. 1MAH_r is a Mus musculus protein structure and 1MAH_l a Dendroaspis angusticeps' one, a highly venomous snake. The analysis of all proteins in the dataset is reported in Figures S60–S73 in Text S1.

