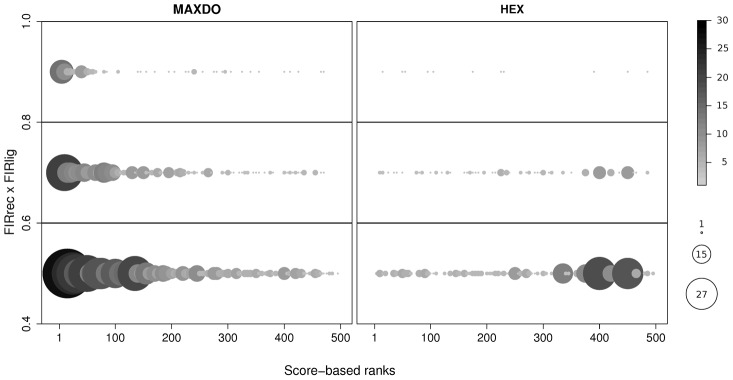
Figure 8. Comparison of MAXDo and HEX on the Enzyme-Inhibitor dataset.

The 500 best scored conformations, computed with MAXDo and HEX, for each of the 46 native complexes in the Mintseris' Enzyme-Inhibitor dataset are plotted with respect to  (computed on experimental interfaces;
  -axis) and score-based ranks (computed with JET+NIP;
  -axis). The
  -axis is defined with respect to three main intervals,
  ,
,  and
and  , and the
  -axis varies between 1 and 500. Each interval on the
  -axis is associated to a distribution of ranks, where a bin in the distribution corresponds to 5 consecutive ranks. Bins are represented as circles and their sizes vary from 1 to 20. Colors are redundant with sizes.
