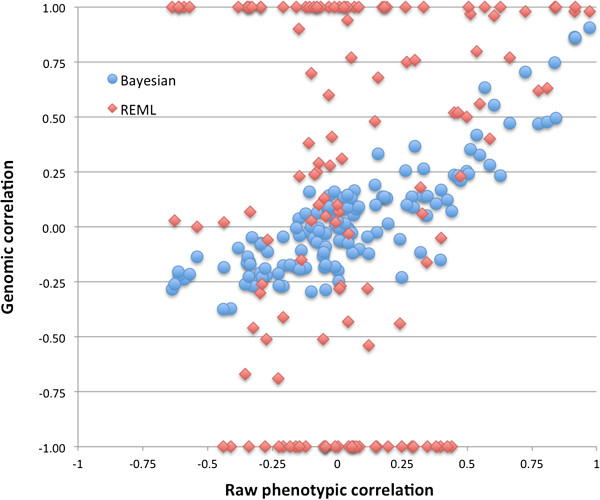
Figure 2.

Raw phenotypic correlation between the fatty acids (x-axis) plotted against the genomic correlation between the fatty acids (y-axis) estimated using a bivariate Bayesian model (blue dots), and a bivariate REML model using a genomic relationship matrix (red diamante).
