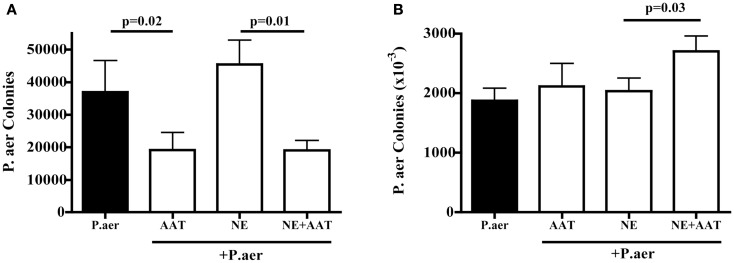
Figure 5.
Effect of AAT on P.aer internalization and adhesion in A549 cells. In four separate experiments, A549 cells were exposed to P.aer alone (closed bars) or to P.aer in the presence of 5 mg/mL AAT, 2 μg/mL NE, or NE with AAT. In bacterial internalization experiments (A) and surface adhesion experiments (B), A549 cells were lysed and concentrations of released bacteria calculated after culture on LB-agar plates. p-Values are indicated in the graphs. Data are depicted as means + SEM of bacterial colonies.

