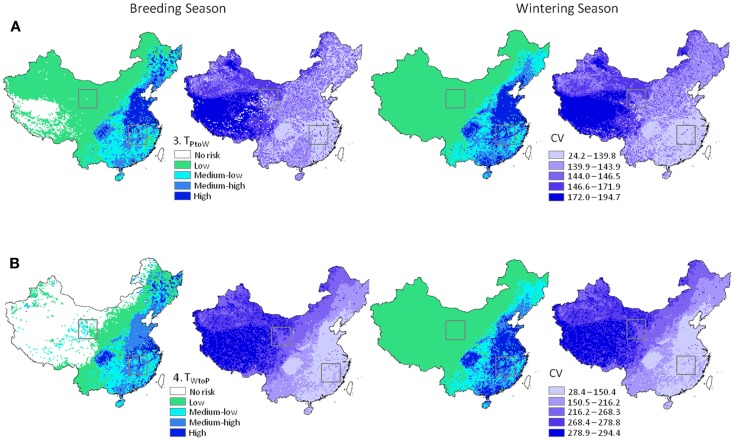
Figure 4.
H5N1 transmission risk between wild and domestic birds in China and associated uncertainty predictions at 30 km resolution. Risk maps represented as mean and CV (left and right in each pair of maps, respectively). (A) Top panel represents transmission risk from poultry to wild waterfowl; (B) bottom panel represents transmission risk from wild waterfowl to poultry. Maps are symbolized using quantiles. Black boxes correspond to the Qinghai Lake and Poyang Lake Regions outlined in Figure 5.

