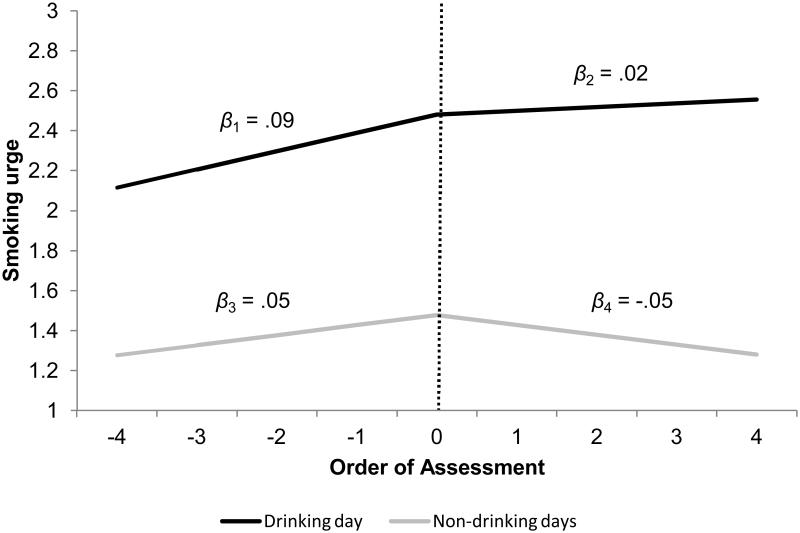
Figure 3.
Smoking urge trajectory before alcohol consumption (slope =.09) was significantly different from that after alcohol consumption (slope = .02) on drinking days. Smoking urge trajectory before the “cut-point” (slope =.05) was significantly different from that after the “cut-point” (slope = -.05) on non-drinking drinking days. The dotted line indicates the time of first alcoholic drink/cut-point. Smoking urge was measured on a five point scale that ranged from “no urge” to “severe urge.” In this figure, the order of assessment is centered on the time of first alcoholic drink, with negative values indicating to pre-drinking/cut-point assessments and positive values indicating post-drinking/cut-point assessments.

